Introduction
This post is an informal summary of the paper “A deep-learning representation of multi-group cross sections in lattice calculations“1 published in Annals of Nuclear Energy on January 2024. The paper is open access thanks to KTH, and the figures here were taken from the paper. This paper is the first out of two (link here) where we attempted to predict high dimensional multi-group cross-section (MGXS) libraries based on the reactor operating conditions and the nuclide composition in the fuel pellet material as input variables. Such MGXS libraries are used in deterministic nuclear simulator codes for various applications such as lattice calculations and even pin-resolved full core simulations.
** For people unfamiliar with nodal core simulations or MGXS library generation, the purpose of this work will seem rather confusing. I omit here the background information in order to focus more on the actual novel ML application that we developed. In future I may write up a separate post to provide a more comprehensive background2.**

This concept is not new, and a similar regression problem exists for predicting few-group assembly averaged cross-section (FGXS) libraries based on historic parameters and instantaneous operating parameters for nodal codes. However, our problem differs from the nodal FGXS regession problem in several key ways.
High dimensionality MGXS libraries
The major difference between earlier nodal FGXS regression and our current MGXS regression is the large number of input and output variables in our model. This is due to several factors.
Firstly, nodal FGXS representation models account for nuclide composition effect on parameters through a “burn-up parameter” measured in MWd/THM and historic parameters experienced by fuel pins during depletion. However, our proposed input space is a large set of nuclide compositions found in the fuel pellet material (we truncated to 37 key species which include significant fissile and fertile isotopes and several fission products).
Secondly, nodal FGXS typically have only two-group cross-sections, whereas our MGXS problem has 56 energy groups. It is typical for MGXS libraries to contain 10s-100s of energy groups. In this paper we used the 56 energy group structure found in the SCALE code package.
Finally, we wanted our model to predict the microscopic XS libraries of a large library of isotopes (the 37 isotopes in the input parameter space and a fictitious “BASE” cross-section) while nodal FGXS model only the assembly averaged macroscopic cross-section parameters. This results in our model having ~1000s of output parameters compared to ~10s of parameters for nodal FGXS models. Therefore, our work was to investigate what types of methods could be used for high dimensionality input and output problems.
Model summary
In summary, the problem can be formulated as a regression problem which takes in as inputs the following:
- Nuclide vector of the fuel pin consisting of 37 isotopics ($N$ [atom/b-cm])
- Moderator temperature ($T_{m}$ [K])
- Moderator density ($\rho$ [g/cm3])
- Dissolved boron concentration ($B$ [ppm])
And outputs the following MGXS:
- $\Sigma_{s}$ Scattering matrix of the fuel pellet (56 x 56 = 3136 parameters)
- $\chi$ Fission distribution of the fuel pellet (56 parameters)
- $\sigma_{t}$, Microscopic total XS for 38 nuclides (38 x 56 = 2128)
- $\nu\sigma_{f}$, Microscopic fission XS and multiplicity for 38 nuclides (38 x 56 = 2128)
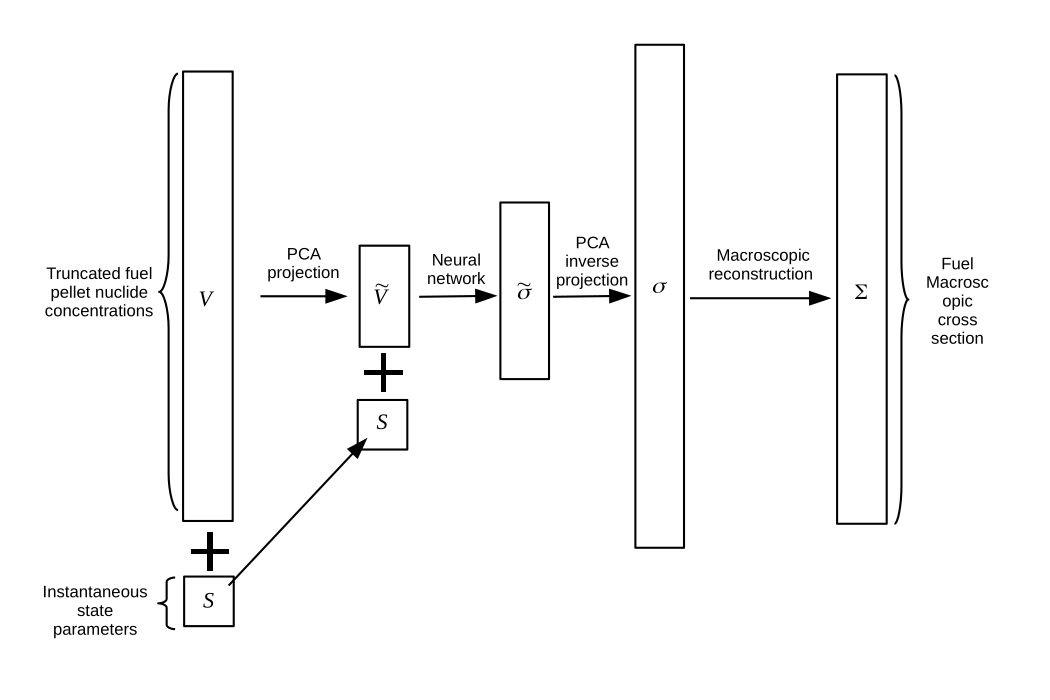
Using PCA for dimensionality reduction
We ended up using a combination of dimensionality reduction to first reduce the number of input and output parameters and then to use regression to map the low-dimensional input space to the low-dimensional output space. We used Principal Component Analysis (PCA) as a dimensionality reduction method for both the nuclide concentrations in the input space and for the various cross-sections in the output space.
PCA on nuclide vector
We employed PCA on the nuclide vector because we observed that that there was a significant degree of correlation between the nuclide isotopes during the depletion process. This is due to the fact that as $U^{235}$ fissions, the concentration of fission products are obviously negatively correlated with the amount of $U^{235}$ left in the fuel. For certain fission product species, this is almost a linear correlation as the isotopes start to accumulate in the fuel pellet.
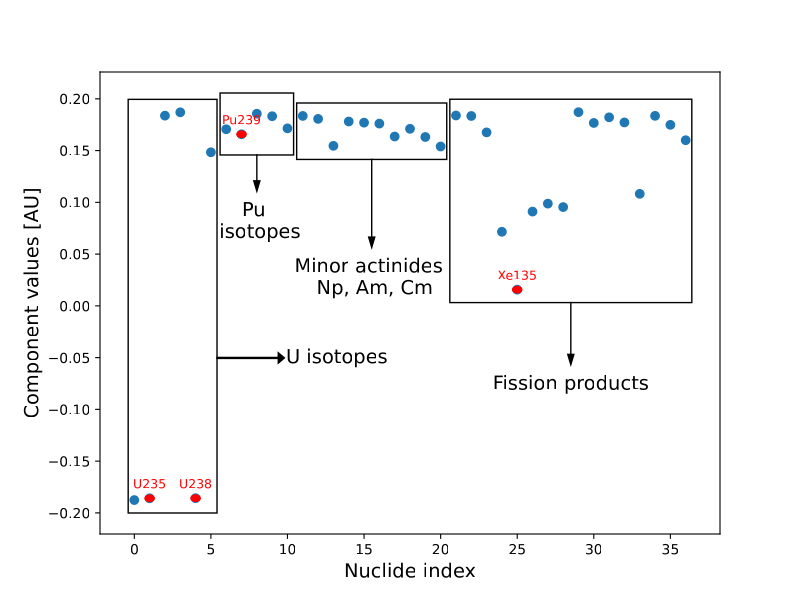
The figure above shows the first component of PCA performed on the nuclide species. The first component is the most dominant axis of variation for all the nuclide vector samples. In this case, the negative variation of $U^{235}$ and $U^{238}$ with the positive variation of actinides and fission products shows that PCA is effectively capturing the variation of the nuclide vector due to fission! As expected, the low dimensional coefficient values show an increasing trend against the burnup time as shown below (the red line shows the mean value and the shaded blue region shows the +/- 1 std.dev about the mean):

The 37 nuclide vector was reduced to 7 components at the 99.9% explained variance ratio as shown in the following table. This indicates that many of the isotopic concentrations are highly correlated, which is expected due to the process of fission. The first component (which really tracks the depletion level in the fuel pellet as stated above) has close to 75.2% of the explained variance.

PCA on 56-group XS parameters
We found PCA to also be effective for our 56-group MGXS libraries (PCA was performed seperately for each nuclide’s 56-group 0MGXS library). Even though the # of energy groups is large in reality only a small handful of energy groups show significant variation in response to variations in the inputs. Most of the nuclides’ total and fission MGXS were reduced from 56 → 3-5 dimensions, a reduction of between 90-95%! Note that for fission MGXS, 16 nuclides are non-fissile and so do not have to be modeled.

This figure shows the size of the XS library after performing PCA dimensionality reduction. The full 56 dimensions are reduced by a significant amount!
We did not perform a very thorough analysis of the PCA dimensionality reduction on every nuclide MGXS library, but we did try to see what was happening for the fission MGXS for $U^{235}$. The figure below shows the first principal component for $U^{235}$ fission MGXS which explained 95.7% of the variance out of a cut-off of 99.9% explained variance i.e. almost all of the variance for $U^{235}$ fission MGXS is in ~4 energy groups.

These energy groups are shown with their continuous energy XS library (from ENDF VIII.0)…

… which shows that the 29, 32 energy groups correspond to a region containing several resonance peaks and the 55 and 56 energy groups correspond to the thermal energy range.
This shows one of the advantages of machine learning. Previously, this sort of dimensionality reduction would have been based on careful engineering experience and empirical knowledge of similar problems: a tedious process prone to error and almost impossible to perform for all the 37 nuclides which we modeled here. Instead, PCA gives us the component vectors and coefficients automatically without any pre-programmed rules of nuclear reactor physics theory.
Use of DNN to map low-dimensional (LD) input coefficients to LD output coefficients
We concatenated nuclides’ MGXS together grouped by reaction type as the output of the DNN model, e.g. all the nuclides’ LD total MGXS library coefficients were grouped together. We then used a fully connected DNN to map the inputs to the outputs. This was implemented on Tensorflow.

We used a 3 hidden layer network with 10 neurons in each layer. The inputs to the model is $\tilde{V}$ (the LD coefficients of the nuclide vector) and $S$ (the state parameters e.g. the fuel temperature). The outputs of the model is $\tilde{\sigma}$, the LD coefficients of the nuclides’ MGXS library.
Results analysis
We tested our MAREN model in two ways:
- By direct comparison of the MAREN generated 56 MGXS with reference MGXS
- Using MAREN MGXS and reference MGXS in a neutron transport problem and compare $k_{eff}$
Error analysis of nuclide microscopic XS libraries
We analysed the errors of the MAREN generated nuclide microscopic XS libraries with reference data for a couple of nuclides and found that in general the relative errors were less than 1%.

$U^{235}$ Total and Fission relative errors

$U^{238}$ Total and Fission relative errors
Macroscopic cross-sections reconstruction
After obtaining the MAREN predicted nuclides’ MGXS libraries, we can reconstruct the fuel macroscopic cross section as
$$
\Sigma = \sum_{i} N_{i}\sigma_{i}
$$
We then compared the generated fuel pellet MGXS library with a reference MGXS library and compared the $k_{eff}$ and pin-power distributions in OpenMOC.

17×17 Assembly model in OpenMOC, note that the fuel pins have 1/4 symmetry and each fuel pin has a different nuclide vector and therefore slightly different macroscopic MGXS libraries

Cell discretization in the radial and azimuthal directions in OpenMOC cells.
| $k_{eff}$ | |
| Reference | 1.117412 |
| MAREN | 1.113429 |
| Difference | 0.398% |
The errors in $k_{eff}$ are very small and for certain applications are sufficiently accurate. The error in the relative pin-power distributions are also very low. Ignoring the non-fission pin positions, the absolute error is $6.47 \times 10^{-7}$ and the heatmap of the pin power errors is shown below.

In summary …
We created MAREN, a model which was able to predict microscopic MGXS libraries for 37 nuclides of the fuel pellet based on the fuel pellet nuclide vector and the state parameters. The major challenge of this task is the high number of input (~10s) and output parameters (~1000s). We used PCA to perform dimensionality reduction, which was especially effective since many of the parameters were highly correlated. This led to a ~ 90% reduction in the number of variables. The values of these LD coefficients were then mapped using a fully connected DNN. The resulting error analysis showed that the regression model was largely successful.
Footnotes
- Y.M Chan and J. Dufek. A deep-learning representation of multi-
group cross sections in lattice calculations. Annals of Nuclear Energy, vol. 195, 2024. ↩︎ - I would recommend the textbook “Modelling of Nuclear Reactor Multi-physics” by C. Demazière (2019) for an overview of reactor physics simulations here ↩︎